For Every Investor Who Has Been Hurt Before

Financial Freedom Is a Right, Not a Privilege.

🕰️

Are you approaching retirement — or already in it — with savings you worked a lifetime to build, yet lying awake at night wondering how long they will last as monthly expenses quietly chip away at what you have left?

🧭

Are you fresh out of college and unsure how to start building wealth early — or deep into your 30s, working hard every month but unable to see a clear path to retirement, FIRE, or financial independence?

📉

Did you follow a stock tip from a friend, guru, or influencer — only to watch it go south while they moved on to the next recommendation?

😰

Did you put your hard-earned savings into an S&P 500 index ETF thinking it was the safest heaven — then watch it drop 15%+ and spend sleepless nights wondering when it would recover?

🏦

Did you park your money in CDs or bonds for "safety" — only to see inflation quietly erase your real purchasing power year after year, leaving you further behind despite doing everything right?

💔

Or were you the target of a romance scam — someone who built your trust, directed you to a convincing fake investment platform, and vanished with every dollar you worked years to save?

If any of this sounds familiar — you are not alone, and it was not your fault. The financial system was not designed with you in mind. We are here to change that.

We built BLEE Quant to give every person — young savers, near-retirees, and the financially independent — equal access to the same disciplined algorithmic strategies once reserved for institutions and the wealthy.

👑
Protect What You Built.
Grow What Comes Next.
Use daily ETF allocation intelligence to pursue long-term compounding, retirement resilience, FIRE independence, Roth IRA growth, and future education funding.

6 Years of Data. Outperforms S&P 500 in Both Return and Risk.

Simulated returns from May 2020 to May 2026, compared against the S&P 500 (SPY). Calm Growth Model returned +177% vs SPY's +155% — outperforming with significantly lower drawdowns throughout.

💡 Real-world example — 2022 market crash: If you had $10,000 in the S&P 500, you could have lost over $2,000 at the worst point of that year. With our model, the maximum loss at any single point was under $500 — a fraction of the benchmark's drawdown, protecting your capital when it mattered most.

Portfolio Growth — $10,000 Starting Investment

May 2020 → May 2026  ·  Includes fees & 1bps slippage  ·  BLEE: +172% (~$27,197)  |  SPY: ~+166.5% ($26,650) — BLEE outperforms on risk-adjusted basis

BLEE Strategy S&P 500 (SPY)

When S&P Fell 18.6%, We Gained 11.2%

The 2022 bear market (Jan–Dec 2022) saw the worst S&P 500 performance in over a decade. BLEE's bond-rotation logic stepped in and generated positive returns throughout the selloff.

2022 Full Year
BLEE Quant Calm Growth Model
+11.2%
Protective rotation into SGOV and bonds shielded the portfolio from equity market volatility. Capital preserved and compounded.
2022 Full Year
S&P 500 (SPY)
−18.6%
The benchmark suffered its worst calendar year since 2008. A $100,000 portfolio would have lost over $18,000 in value.

The Numbers Don't Lie

3-Year backtest (May 2023 – May 2026). BLEE Strategy vs. SPY benchmark.

Metric BLEE Strategy S&P 500 (SPY) Edge
Cumulative Return (3yr) +118.33% +85.63% +32.7pp ahead
Annualized Return +29.07% +22.41% +6.7pp
Max Drawdown −4.75% −18.76% 3.9× safer
Calmar Ratio 5.6 1.23 5.5× better
Sharpe Ratio 1.26 1.45
Beta (Market Sensitivity) 0.55 1.00 Low correlation
Trailing 3-Month Return +14.1% +6.6% +5.3pp
Alpha (vs SPY) +0.13 0.00 Consistent alpha

* Past simulated performance is not indicative of future results. All data generated using full historical backtesting of proprietary algorithm models. Live values for Cumulative Return, Annualized Return, and Max Drawdown above are auto-refreshed daily from the Backtest page after market close. Calmar, Sharpe, Beta, Trailing 3-Month, and Alpha are static reference values from the most recent full backtest.

👤 About the Creator

Built From Real Experience — and Used in Real Trading

Every algorithm model on this site was developed from scratch by a single independent analyst combining three rare disciplines: 30+ years of professional software engineering, 20+ years of hands-on market observation and investments across equities, bonds, and gold, and several years of rigorous backtesting and algorithmic fine-tuning to optimize both performance and risk management across every market cycle.

The signals are not gut feelings dressed up as code. Each Algorithm model is a fully automated, rules-based rebalancing algorithm that ingests daily market data, evaluates momentum and relative-strength conditions across 10+ ETFs, and outputs precise allocation weights — removing emotion and human delay from every decision. The software engineering expertise behind the engine means the logic is rigorous, reproducible, and continuously refined as market conditions evolve.

Most importantly: these are the exact same signals used to manage a personal Roth IRA. Every daily distribution published here is the same rebalancing instruction acted upon with real money — no lag, no filter, no conflict of interest. The result: a live account generating consistent positive returns across 3 years and 5 months of real trading — validating that the algorithm performs beyond what the backtest alone shows.

🌱 Helping investors grow wealth calmly and consistently 📅 20+ Yrs Market Observation 🔬 Multi-Year Backtesting & Tuning 🤖 Fully Automated Daily Signals 💰 Personal Capital Invested 🏦 Roth IRA — Live Account 📊 Stocks · Bonds · Gold
🔴 Live Account · Real Money Actual
Personal Roth IRA Performance
Avg. Annual Return Over 35% / yr
Live Trading Period 2 Yrs 5 Mo
Signal Source Proprietary Algorithm Models
Signal Lag vs. Published None — Identical

Roth IRA figures represent actual account performance, not a backtest. Individual results will vary based on execution timing and account size. Past performance does not guarantee future results.

📄 See details →

Why Calm Growth Model Surges Periodically — and Why That's By Design

If you look at the performance charts, you'll notice Calm Growth Model doesn't grow in a perfectly smooth line. There are calm steady periods, and then sudden upward surges. This is intentional — and it's the core of what makes the algorithm powerful.

Layer 1 · Daily Foundation

🔄 Rotation Across Asset Classes

Every trading day, the algorithm evaluates momentum signals across a universe of 10+ ETFs spanning equity indexes, short-term Treasury bonds (SGOV), and gold. It rotates into whichever assets show the strongest relative strength — and rotates out of weakness. This is the base layer that keeps the portfolio aligned with prevailing market conditions at all times.

Layer 2 · Market Condition Monitoring

📡 Oversold & Overbought Detection

On top of the rotation logic, the algorithm continuously monitors market-wide condition indicators — identifying when key assets become significantly oversold or overbought. These signals go beyond simple momentum; they detect when price dislocations have created a statistically favorable setup that has historically resolved in a predictable direction, validated through years of backtesting across multiple market cycles.

Layer 3 · Periodic Opportunity Capture

⚡ Calculated Aggressive Moves — A Few Times a Year

When both Layer 1 and Layer 2 align — strong directional signal plus confirmed market condition setup — the algorithm concentrates into a high-conviction position. These opportunities arise roughly several times per year. Each type of move has been exhaustively backtested to confirm positive expected value and acceptable maximum loss before it was ever included in the live strategy. The result: the periodic performance surges visible in the charts.

⚡ The Surges You See in the Charts Are Not Luck

Each sudden jump in the Calm Growth Model performance line corresponds to one of these few times a year high-conviction moves — a deliberate, backtested, rules-based action triggered only when specific market conditions are confirmed. The rest of the time, the algorithm runs quietly in rotation mode, protecting capital and compounding steadily. This two-speed design — patient most of the time, aggressive when conditions are right — is what produces both the low maximum drawdown (about −6.7% over the full period) and the outsized annual returns. It is not active trading noise; it is disciplined opportunity capture built on 20+ years of market observation and 30+ years of programming discipline.

Several×
High-conviction moves per year

One Algorithm. One Goal: Long-Term Wealth.

A single, focused strategy — algorithmically managed and published daily around 3:55 PM ET. Rebalance anytime after 3:55 PM ET — before close or after hours, up until 8 pm ET — for a consistent, disciplined strategy with no day-trading concerns.

🏦
Bank Savings / CDs
~4%/yr
Near-zero downside risk
Safe, but loses ground to inflation over time. After taxes, real gains are minimal.
💰
Dividend Stocks
~8%/yr
Market roller coaster
Better yield, but share prices swing with the market. A bear market can erase years of dividends overnight.
📊
S&P 500 Index
~10–23%/yr
Up to −27% in downturns
Strong long-term average, but brutal drawdowns. In 2022 alone, the S&P fell nearly 19% — costing real-money investors months of sleep.
🛡️
Calm Growth Model (Backtest)
~27%/yr (3yr)
Max drawdown about −4.9% (3yr)
Designed to outperform while keeping losses contained. In 2022, it gained +11.2% while the S&P fell. Long-term growth — without the sleepless nights.
Recommended Start
🚀

Want more than 4% in savings — without the S&P roller coaster? Start here.

Calm Growth Model is built for long-term, disciplined growth. Combining rule-based ETF rotation with defensive risk management, it aims to outperform traditional savings and dividend-oriented strategies while seeking lower drawdowns during difficult market conditions. Signals publish around 3:55 PM ET across just 2–3 ETF positions. Rebalance anytime after 3:55 PM — before close or after hours, up until 8 pm ET. Simple to follow. No sleepless nights.

Start with Calm Growth Model →
🛡️

Calm Growth Model

Moderate Gain · Low Risk

A rules-based algorithm monitoring 10+ ETFs across equities, bonds, and gold, yet typically signaling rebalances across just 2–3 positions per day — simple enough to execute in minutes. Designed to capture steady upside while rotating defensively during market stress.

🎯 Who is Calm Growth Model for?

  • Investors tired of bank savings at ~4% or CD rates that barely beat inflation
  • Those holding dividend stocks (~8%/yr) but sick of watching their portfolio swing with every market headline
  • Anyone who wants to potentially beat the S&P 500 — but without stomach-dropping −20% to −27% drawdowns during market downturns
  • Investors approaching or in retirement who need steady growth without the risk of a large loss wiping out years of savings
  • Long-term, patient investors looking for peace of mind — a strategy you can follow without losing sleep over daily market swings
  • People who want a simple daily signal (2–3 ETFs, ~3:55 PM ET) — rebalance anytime after 3:55 PM ET, before close or after hours, up until 8 pm ET. No day-trading concerns regardless of which window you use
  • Investors of any account size — no minimum balance required. Because rebalances always execute the following trading day (not intraday), this model does not trigger Pattern Day Trader (PDT) rules and does not require the $25,000 minimum account balance that PDT-flagged accounts must maintain

No Day Trading. No PDT Concerns. No $25K Requirement.

The signal updates around 3:55 PM ET. You can rebalance anytime after that — before market close or during after-hours trading, any time up until 8 pm ET. Buying after 4:00 PM and selling the next trading day does not trigger a day trade. Because all rebalances execute on the following trading day, this strategy is generally designed to avoid Pattern Day Trader (PDT) classification and can be followed with accounts of any size — whether starting with $1,000 or $1,000,000.

−4.9%
Max Drawdown (3yr)
27%
Avg Annual Return (3yr)
5.6
Calmar Ratio
0.55
Beta
View Daily Analysis →

Built for Serious Long-Term Investors

We do the research. You make the decisions. Every day, fresh algorithmic signals so you're never flying blind.

🕓

Signal Updates Around 3:55 PM ET

Distributions update daily around 3:55 PM Eastern Time. Rebalance anytime after that — before market close, or after hours up until 8 pm ET. Buying after 4:00 PM and selling the next day does not trigger a day trade, so there are no PDT concerns regardless of which window you choose.

🛡️

Proven Downside Protection

Maximum drawdown of about −4.9% over the past three years — including the brutal 2022 bear market where the S&P fell nearly 19% and broad market investors saw years of gains erased overnight.

🔬

Years of Backtesting & Fine-Tuning

The algorithms were not rushed to market. Multiple years of backtesting across bull, bear, and sideways markets shaped every parameter — optimizing for both return and risk management simultaneously.

🤖

Engineering-Grade Automation

Helping investors grow wealth calmly and consistently — through fully automated daily signal generation, rules-based rotation that follows market data, not headlines or emotions.

🤝

Real Skin in the Game

The creator actively trades these ETFs in a personal Roth IRA. Every signal published here is the same one being acted on with real money — not a theoretical model sold by someone on the sideline.

Simple Daily Action

Calm Growth Model tracks 10+ ETFs but typically signals just 2–3 rebalances per day. No complex order books, no options — just ETF redistributions you can execute in any brokerage account in minutes.

Invest in Your Edge

Self-directed ETF allocation intelligence for investors who want daily structure, market context, and disciplined rebalancing guidance.

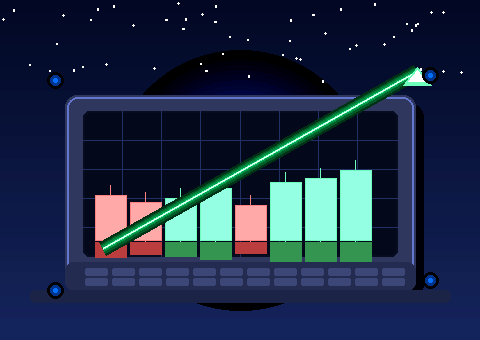
📈 3-YEAR BACKTEST · CALM GROWTH MODEL
$10,000 → $22,306
May 2023 → May 2026 · fees & slippage included
+123%
Total Return
+30%
Annualized
−4.75%
Max Drawdown
Subscription
$480/yr
signal paid for itself 25×
Simulated backtest — not actual trading results. Past performance does not guarantee future returns.
✅ START HERE — FREE
📧 Free

Newsletter & Market Forecast

$ 0 /month

Free access — register once and unlock the Market Forecast, Backtest history, and weekly newsletter

  • 📊 Daily Market Forecast — upcoming Market Opening weather forecast, by Quant Research Engine
  • Backtest section access
  • Weekly market newsletter
  • BLEE research updates
  • Daily signal page
  • Email & SMS alerts
  • Auto-trade tools
Free plan
Join Free — No Credit Card

Instant access · No credit card

🔜 COMING SOON
🚀 Pro

Brokerage Integration

$ 49 /month
or $490/year — save $98 (2 months free)

Daily signals + BLEETrader app with 1 auto-trade investment model

  • Everything in Starter
  • Daily email signal alert
  • Daily SMS signal alert
  • BLEETrader desktop app (Win/Mac)
  • 1 auto-trade investment model (Schwab/IBKR)
  • You stay in full control
  • Priority email support
Pro plan

We'll notify you when Pro launches

🔜 COMING SOON
💎 Ultimate

Full Quant Intelligence Suite

$ 199 /month
or $1,900/year — save $488 (over 2 months free)

Everything in Pro — plus our full BLEE Quant investment model suite

  • Everything in Pro
  • 2 auto-trade investment models (full BLEE suite)
  • SGOV Bond Min Dual Reversal strategy
  • Possible 40%+ annual returns with same Pro model low risk
  • You stay in full control
  • Priority support & early access to new models

We'll notify you when Ultimate launches

Ultimate plan - Goal Achieved

Important Disclosure — Please Read: BLEE Quant Analytics publishes proprietary algorithm model outputs for informational and educational purposes only. Nothing on this website constitutes personalized investment advice, a solicitation to buy or sell securities, or a recommendation tailored to any individual's financial situation. Subscribers are solely responsible for their own investment decisions.

Backtest vs. Live Performance: Performance figures labeled "Backtest" or "Simulated" are hypothetical results produced by applying algorithm logic to historical market data. They were created with the benefit of hindsight and do not reflect actual trading. Figures labeled "Live Account" reflect the creator's personal Roth IRA account returns, which are real but individual — your results may differ materially based on execution timing, account size, fees, and other factors. Past performance, whether simulated or actual, does not guarantee future results. Investing involves risk, including the possible loss of all invested principal.

BLEE Quant Analytics is an independent research service operated by a private individual. It is not a registered investment adviser under the Investment Advisers Act of 1940 or any state law. It is not affiliated with, endorsed by, or sponsored by any brokerage, ETF issuer, or financial institution. Please consult a qualified, licensed financial adviser before making any investment decisions.